geschätzte Lesezeit: 48 min
August 14th, 2021, Update #1: Release 2021.8.0 has introduced a new feature for sensors called long-term statistics. A new sub-section called Long-term statistics was added to the HASS database section that describes its relation to the states table and how to implement it. The same release also introduced the Statistics Graph Card, which provide a nice way of visualizing long-term statistics.
top
Home Assistant (HASS) is a free and open-source software (FOSS) that provides a feature-rich environment for managing, controlling, and automating smart home devices, such as light bulbs, blinders, and LED strips. In addition, it provides a highly customizable system for collecting and organizing a multitude of data (e.g., on/off device states, local temperature, GPS tracking, exchange rates), as provided by more than a thousand integrations with Internet of things (IoT) devices (e.g., Sonoff, Wyze, Z-Wave), local sensors (e.g., micro-controllers or single-board computers connected to sensor modules), and cloud-based services (e.g., weather and financial web APIs).

More often than not, people use HASS to view or modify the current state and value of integrated devices and sensors via manual triggers (e.g., pressing a button to turn off the AC) or automations (e.g., if the temperature is lower than 14°C, then turn on the heat). However, the HASS utility integrations offer users the possibility to go beyond with the help of built-in mathematical and statistical tools. More specifically, such analytical tools allow users to summarize past states and measurements to answer questions such as:
- How many times has the front door been opened over the last 24hrs and for how long?
- How much energy (kWh) has my uninterrupted power supply used over the last month?
- What was the average temperature in the living-room in the last 24hrs? How does that compare to 48hrs before?
- What is the average level of volatile organic compounds (VOC) measured by the BME680 sensor in my bedroom in the last thirty minutes? How much does it change over the day?
Unfortunately, according to the HASS website, the Statistics and related utilities are currently used by less than 5% of the HASS userbase. I feel there is much to be explored and gained from the application of dynamic statistical inferences in home automation systems. To mention a few reasons, sensors are susceptible to measurement error and many user-defined events (e.g., Carlos is at home) are multidimensional and frequently determined by more factors than integrated within a home automation system (e.g., my cellphone connected to my home’s private network is not a sufficient condition to tell that I’m at home but it does inform about the likelihood that I am at home). This creates uncertainty about the current and future states of things but fortunately, this uncertainty can be quantified and taken into account by various statistical tools that have long been developed.
Furthermore, the fact that HASS integrations are written in the Python programming language makes HASS a prime candidate for exploring the use of statistical inference in home automation systems because many mathematical and statistical packages are already available in Python and are widely used and well-maintained (e.g., numpy and scipy). Therefore, porting new and more sophisticated analytical tools to HASS should be fairly straightforward. (More on this in the Development section).
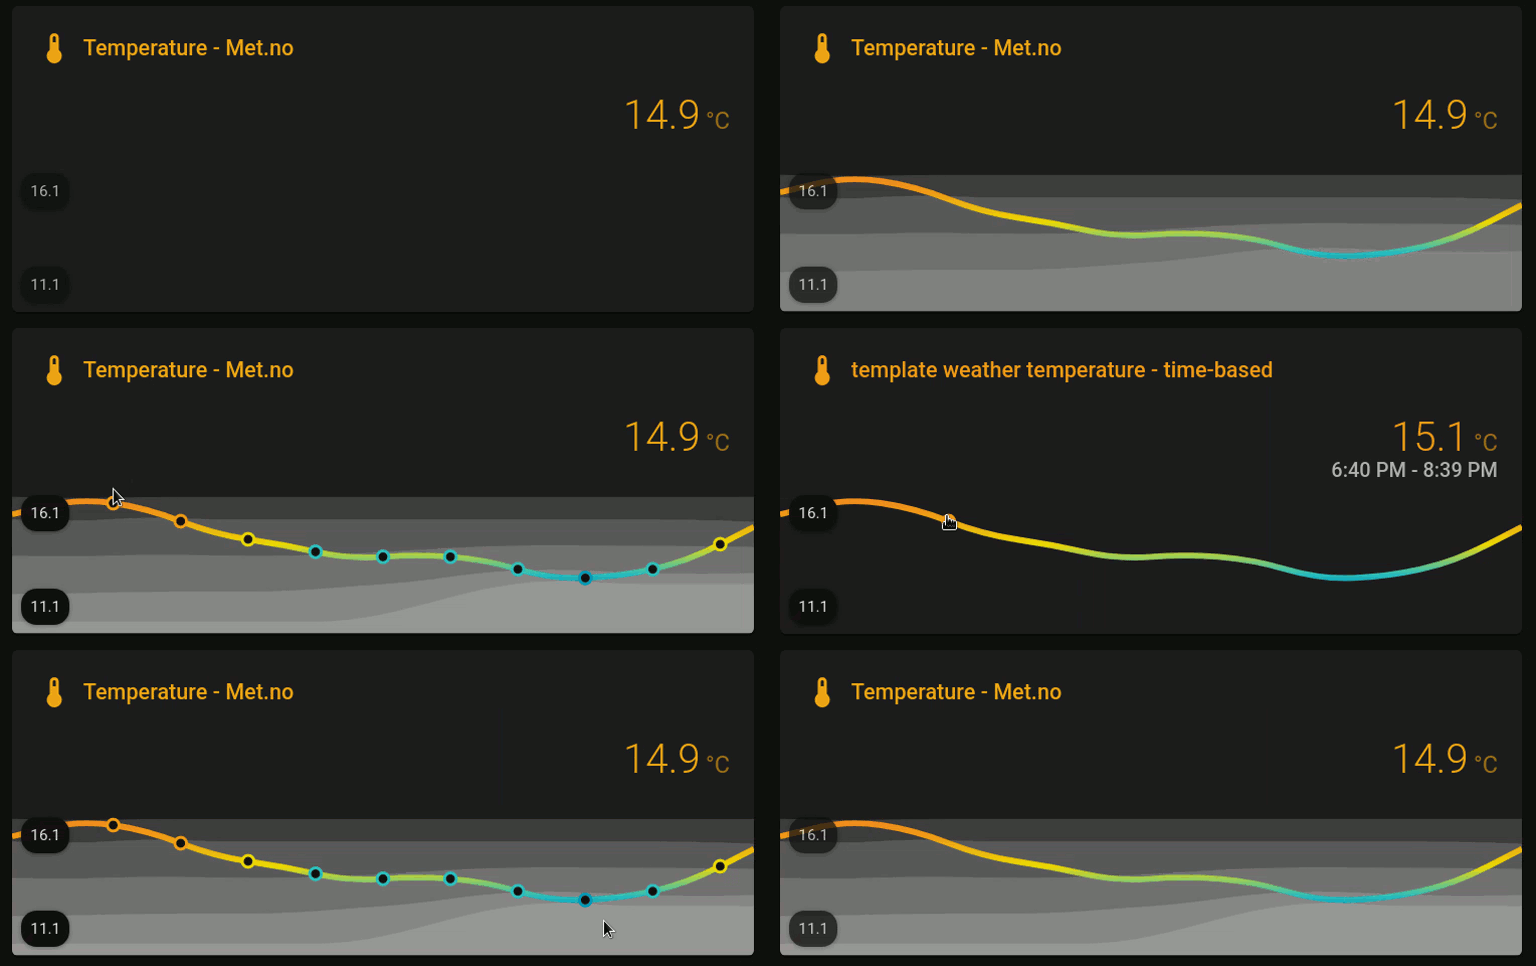
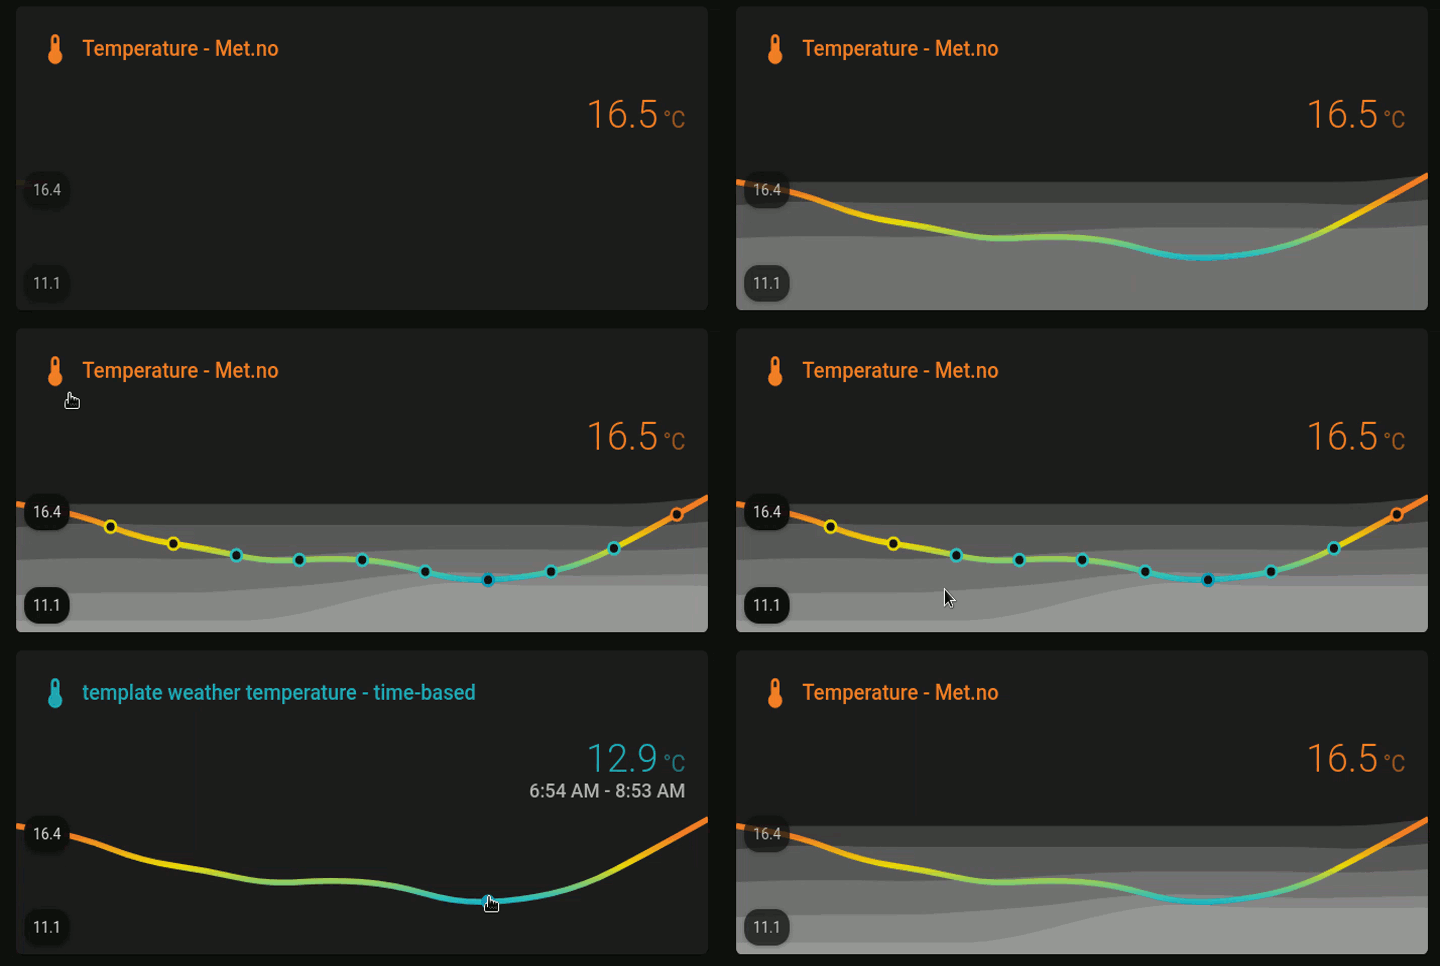
At the very least, the current analytical tools can be used to improve the quality of the information in your HASS dashboard. For example, instead of simply displaying the current temperature, the use of analytical tools allow us to set dynamic color thresholds based on the mean and deviations from it (± one standard deviation, then min-max) over the last 24hrs:
But there’s much more that can be done and accomplished moving forward. If you find these ideas interesting and want to get started on their implementation in your own personal HASS, then read on. As in my previous guides and tutorials, I tried to unpack and digest as much of the content as possible, the goal being to make it accessible to experts as well as novices. Check the Changelog for updates and if you ever get stuck on something or just want to share a few ideas and opinions, feel free to get in touch with me.
top
- Get familiar with the following:
- The HASS SQLite database (DB);
- YAML syntax;
- Templating.
- Learn the specifics about how data are sampled and stored in the HASS DB and how they affect analysis, owing to inconsistent data points and misrepresentation of data over time;
- Familiarize yourself with the use of three utility integrations:
- History Stats;
- Statistics;
- Trend.
- Make use of analytical data to improve your current HASS dashboard using the following cards:
- Mini graph card;
- Lovelace card templater.
top
From this point forward, the article was divided into two main parts:
-
(Optional.) Prerequisites: A brief overview of the HASS core installation, configuration files, and database. At the end of this section, there is a few statistics resources for users who want to refresh their stats knowledge. Advanced users might want to skip this section altogether. However, at the very least, I suggest to glance over each topic to make sure we are all on the same page.
-
Implementation: This is the main part of the article. I started describing in detail the issues pertaining to how data are sampled and stored in the HASS DB. Afterwards, I reviewed three of the current Utility integrations that I find most useful and finally, at the end, I mentioned two JavaScript modules that are useful in visualizing analytical metrics within the HASS dashboard. (If you came here just to learn how to build a dynamic threshold graph card, feel free to head straight to the section called Visualizing analytical data.)
top
The implementation of analytical tools in HASS has the following basic requirements:
- A HASS core instance;
- Understanding of the configuration files and the YAML syntax;
- Understanding the HASS database;
- And of course, basic statistics knowledge.
Those four topics are described separately next.
HASS core
Structurally, HASS can be divided into three main layers: (a) core; (b) supervisor; and (c) operating system (OS). The folks at the HASS wiki were kind enough to put together a plethora of installation methods for all sorts of OSes and environments (bare-metal vs. virtual). For this guide, however, only the most basic layer of the HASS system is needed, namely the HASS core, which is available in any installation method.
Instead of using an existing HASS instance, I strongly recommend to create a containerized (Docker) HASS instance for testing purposes. This will be much safer than playing with an existing HASS instance and its database.
To create a HASS Docker container, follow the instructions in the official documentation:
- Install Docker Engine - Community Edition;
- (Optional.) Install Portainer - Community Edition to manage your Docker containers;
- Install HASS Docker container.
Of note, after deploying the HASS container, use a host’s text editor (e.g., nano, vi, vim, pluma) to edit the configuration.yaml file and related configuration files. Whenever you create a new .yaml file, make sure that the HASS user will have permission to read it at the very least, or you will run into issues. Finally, in the HASS webUI, your HASS user must be able to access the Developer Tools > Services tab to check the state of each entity and their attributes. The default admin user should have access to such a resource.
HASS configuration files
The configuration files in HASS use a human-readable data serialization language called YAML (YAML Ain’t Markup Language). In this guide, we will use YAML to edit and create configuration files for HASS that will customize database settings and new entities to collect data and help with their visualization.
If you are new to YAML, take a few minutes right now to familiarize yourself with it. The HASS wiki has a straight to the point explanation that I invite everyone to read:
To highlight a few important points about the configuration files and the YAML syntax:
- Indentation and spacing in general are very important in YAML. Use only the spacebar and maintain consistency across all configuration files. If at all possible, use an editor that shows whitespaces when editing any YAML files;
- UPPER and lower cases matter;
- Use
# to add comments;
- Use
"" (double quotation marks) for escaping special characters in sequences (e.g., "Hey! What's up?") and '' (single quotation marks) when escaping is not necessary (e.g., 'Nothing much.');
- Use the
!include for splitting up your configuration.yaml. For instance, instead of adding all your sensor: and binary_sensor: to the configuration.yaml file itself, create sensors.yaml and binary_sensors.yaml files in the config/ directory and then use !include to add them automatically to your configuration.yaml:
# Sensors
sensor: !include sensors.yaml
binary_sensor: !include binary_sensors.yaml
- Use
!secret and a secrets.yaml for managing passwords. (See more in the HASS wiki called Storing secrets.) This is particularly useful if you plan on sharing your configurations.
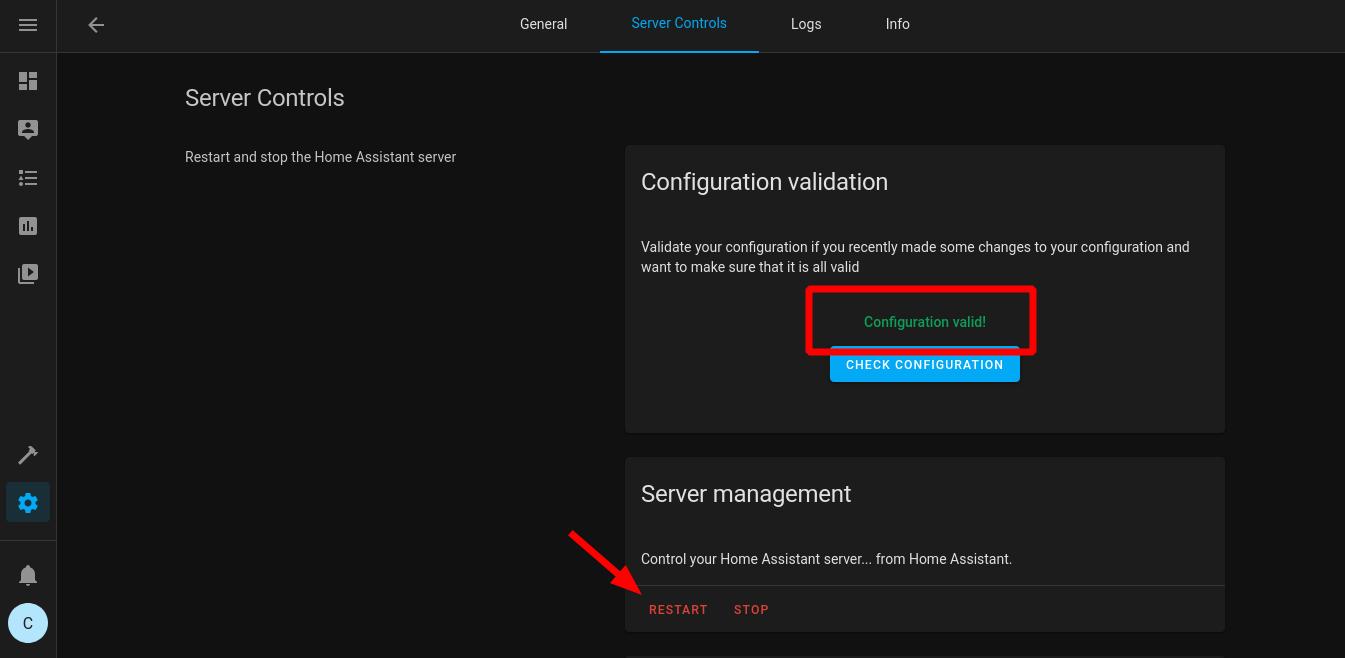
Finally, after making any changes to any YAML file (and saving them), it is necessary to reload the configuration.yaml file. If your installation method does not allow for selective reloading, then go ahead and reload the entire HASS. However, before reloading any configuration file, use the hass --script check_config script to make sure your configuration.yaml file is okay, as follows:
-
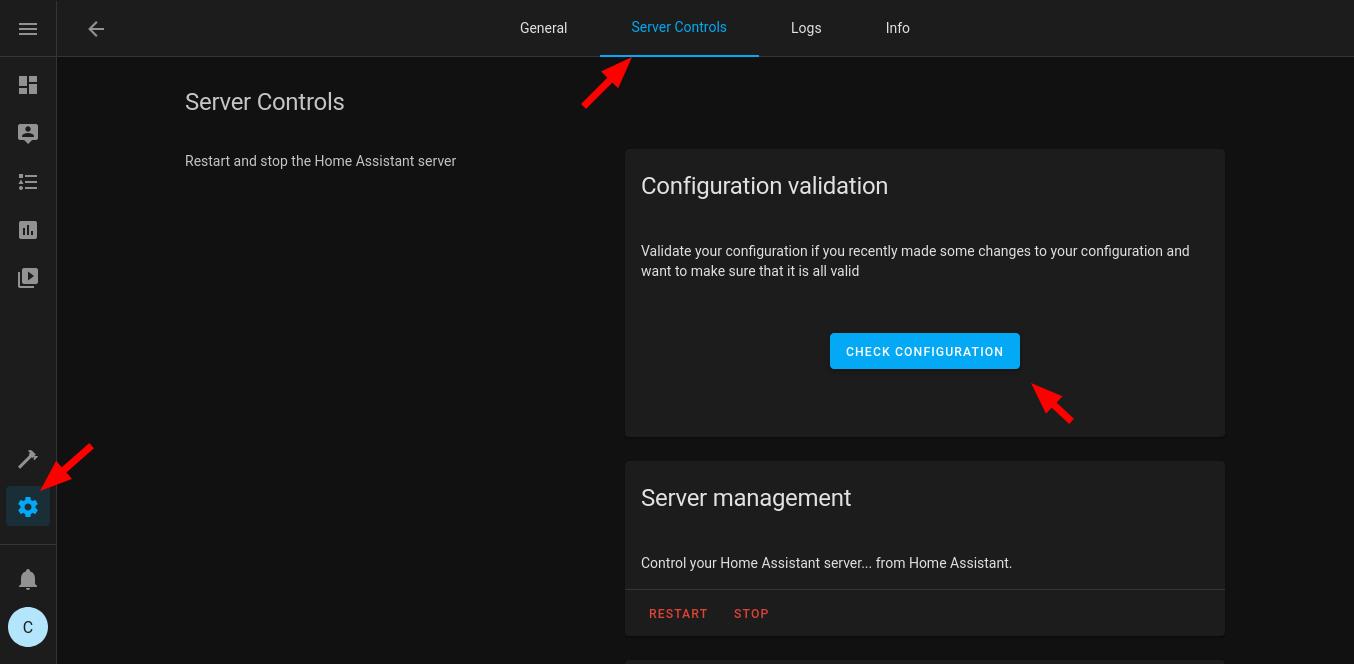
From within the HASS webUI, navigate to Configuration > Server Controls > Configuration validation.
Alternatively, if running the HASS Docker container, use docker exec homeassistant python -m homeassistant --script check_config --config /config to run the check_config script from your host machine. (This assumes that your HASS container is called homeassistant. If this is not the case, change it accordingly.)
Always keep an eye on the home-assistant.log file for errors. This will greatly help you troubleshooting most issues on your own (e.g., incorrect references or operations in templates).
HASS database
HASS uses a relational database (DB) management system (RDBMS) based on the SQL engine and by default, it creates a SQLite DB in config/home-assistant_v2.db to track events and parameters over time. If you want to learn more about and dive into the HASS DB, including how to create your own SQL backend, take a look at the two following resources:
Fortunately, most users won’t need to learn RDBMSes and SQL to take advantage of analytical tools in HASS because the default SQLite DB is usually enough. However, there are a few aspects about the default settings that can affect the way the data are analyzed. Those aspects are described in more detail next.
Default database
In the configuration.yaml file, the default SQLite DB is created along with many of the other default settings by the following configuration variable:
To change the default DB settings, it is necessary to add a recorder: configuration variable to the configuration.yaml file, as follows:
default_config:
# Customized DB settings
recorder:
The documentation of the specific recorder: variables can be found at the HASS wiki:
In brief, by default, the HASS DB keeps historical data up to 10 days (purge_keep_days: 10), running an automatic purge of the database every night to prevent the DB from increasing in size indefinitely (auto_purge: true). Therefore, if you want to keep data from one or more entities for longer than 10 days, then you must edit the DB default settings. Personally, I prefer to keep data for two weeks instead (14 days), so I usually change my recorder: configuration to the following in the configuration.yaml file:
default_config:
# Customized DB settings
recorder:
  purge_keep_days: 14
The include and exclude filter parameters are particularly useful whenever working with non-default settings, as they help you specify which entities should be tracked. Check the HASS wiki Configure Filter for examples.
In addition, as mentioned before, the default DB is stored in your config/ directory and also by default, changes are committed to the DB every 1 sec (commit_interval: 1). This matters because if you are collecting data over a time window lower than 1 sec, then you might want to change the commit interval to 0 (zero, or as soon as possible) instead. At this point, it is also important to consider where the DB is being physically stored (SD card, eMMC, HDD, or SSD), owing to disk I/O and wear and tear considerations. (More advanced aspects come into play if HASS is not the only application committing to the DB but I trust that if this is your case, then you probably know how to customize the HASS DB accordingly.)
For advanced users who want to browse and manually add/edit entries from the default (SQLite) home-assistant_v2.db, it is possible to use the SQLite Database Browser. Just keep in mind that the default HASS DB might have permissions (ownership and group membership) that are incompatible with your current host user and therefore, you might be unable even to read the DB without first editing the permissions–in Linux, appending sudo to sqlitebrowser should give you access no matter what though.
Resetting entity data in the DB
In addition to the SQL browser method of editing the HASS DB, HASS allow users to run a service call from within the webUI to manually run a purge task. This is particularly useful to run once you are done making changes to a newly created template entity and want to clean any previous (and possibly erroneous) records from the DB. To remove all the data from a list of entities, do the following:
- Navigate to Developer Tools > Services;
- Select Go to YAML mode and paste the following:
service: recorder.purge_entities
target:
  entity_id:
    - sensor.my_template_entity_01
    - sensor.my_template_entity_02
in which sensor.my_template_entity* are the target template entities you want to purge;
- Press Call Service to purge their data from the DB. The new data will be collected as soon as an update is triggered (see the Sampling section).
Of course, there are other recorder services available in the Developer Tools > Services tab. Feel free to explore them.
Long-term statistics
Release 2021.8.0 has introduced a new feature for sensors called long-term statistics. In brief, sensor data (e.g., the state value and the sensor attributes) are stored on the states table of the HASS DB. Now, however, sensors that opt-in for long-term statistics have three summary statistics (mean, min, and max) stored on a new table of the HASS DB, called statistics. The statistics data are unaffected by the recorder configuration in the configuration.yaml file and therefore, it allows users to keep summary statistics for longer than the recorder configuration allows to keep data in the states table.
The summary statistics are stored on an hourly basis. That is, if a sensor has stored five data points between 2PM and 3PM, then for each summary statistic, there will be a single data point for the 2-3PM time window that summarize the five data points in the states table. Therefore, making use of such a feature only makes sense if your sensor stores more than a single data point per hour.
Currently, there are two types of long-term statistics that are stored on the statistics table of the HASS DB, all of which must include the state_class: measurement property and thus must refer to present time measurement (e.g., current temperature, current humidity):
-
Metered entities: Apply to any sensor that has cumulative values until a reset point, such as energy consumption meters. All such sensors must include the last_reset property, which specifies a datetime in which the values reset.
-
Value entities: Apply to any non-cumulative sensor that belongs to a supported device class. Naturally, all such sensors must include the device_class property.
Many integrations are currently configured to store summary statistics on the statistics table of the HASS DB, so you might not need to manually configure anything at all. However, support for long-term statistics is still quite limited. As far as I can tell, the only other feature that makes use of the data in the statistics table is the new Statistics Card Graph, which is mentioned later on in the Visualizing analytical data section.
You don’t need to be a mathematician who specialized in statistics to make use of it. In this guide, we will only make reference to very introductory statistical knowledge, such as measures of central tendency (e.g., mean, median), variability (e.g., variance, standard deviation) and simple (univariate) linear regression (e.g., gradient/slope).
The goal in this guide is to present a starting point for more advanced usage of analytical tools in home automation systems. The possibilities are endless for knowledgeable users (e.g., application of Bayesian methods, dynamic mixed-effects modeling) and how far you will go along these paths is up to you.
If you want to refresh your stats knowledge or dig deeper into it, save some time and take a look at the following resources:
- Reading material:
- Basic stats refresher:
top
The main functionalities in HASS are extended by the configuration of new integrations. According to the HASS Glossary,
Integrations provide the core logic for the functionality in Home Assistant.
Therefore, the analytical tools covered in this guide are implemented by one or more of the 1800 integrations that are currently supported by a community of home automation enthusiasts. More specifically, most of the analytical tools are grouped under Utility integrations and in this guide, I will only cover the following three:
- History Stats
- Statistics
- Trend
The current set of analytical integrations is fairly limited in what it can do. For the most part, the tools can be used to create summary statistics of the past states and measurements of integrated devices and sensors. Inference-wise, a lot can be done via templates but moving forward, there is a need for more advanced analytical integrations. For this reason, at the end of this guide, I added a section about Development for anyone interested in helping out. First, however, we need to talk about Data and Sampling.
Data
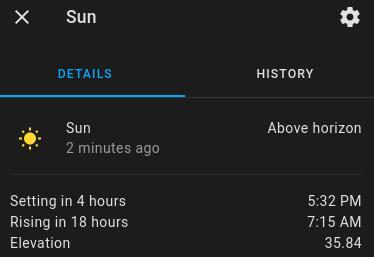
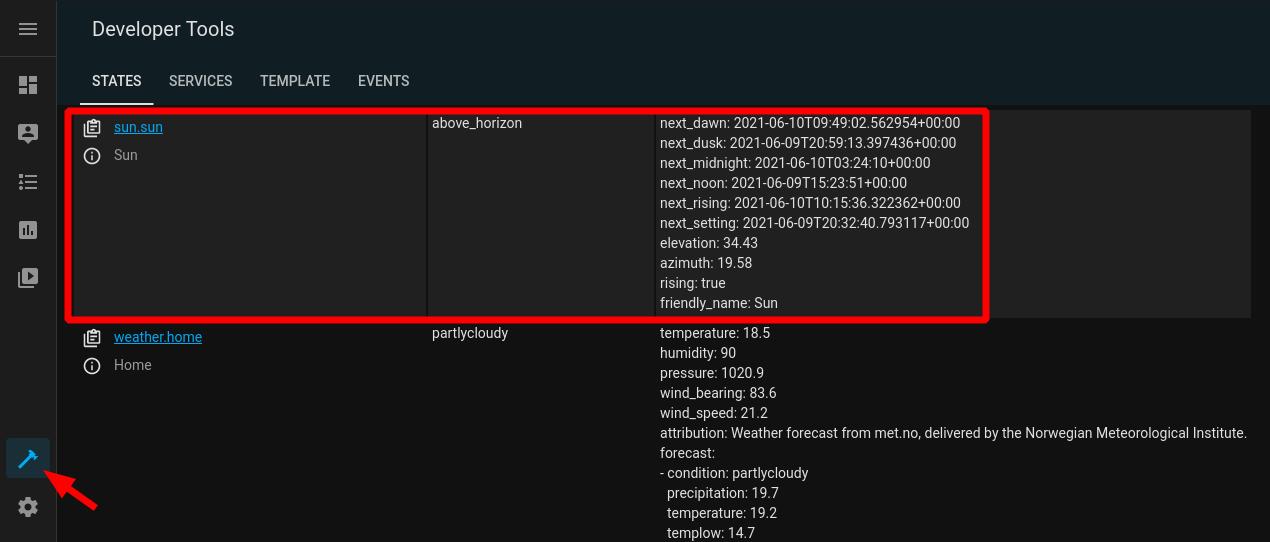
Before delving into any analytical integration, there are at least three things that we need to do. First, we need to think about the nature of the data. For example, consider the default Sun (sun.sun) entity in HASS:
While the sun.sun state is a discrete variable (it’s either above_horizon or below_horizon), its elevation attribute is actually continuous (e.g., 35.84° between the sun and the horizon) and therefore, it doesn’t make sense to use the same tools to analyze both of them. Nonetheless, discrete variables can be transformed into continuous ones (e.g., the sun was above_horizon for 34.1% of the day), and similarly, continuous variables can be discretised (e.g., the elevation is either negative or positive or zero) in order to better answer our questions of interest.
Second, we need to check whether HASS is keeping track of the data we need. There are multiple ways of doing that but by far, the easiest method is to navigate to Developer Tools > States and then make sure that the entities whose states and attributes we would like to keep track of are being listed there. (Alternatively, you can open the HASS DB with a SQL browser and look for the entity in the states Table.)
Third, we need to check how the data are being represented in the DB. As in the previous example, some variables might be an attribute of an existing entity in the HASS DB. If the recorder: settings for such entity are fine for the type of analysis you want to automate (e.g., purge every 10 days), then you are all set. However, notice that attributes cannot be displayed the same way as the states of an entity in the HASS webUI. In addition, you might want to pre-process the attributes (e.g., float and then round(2)) or perform transformations before running the analysis.
For all such reasons, I always create new entities for the variables that will be analyzed. This is accomplished with the template integration. Per the HASS wiki:
The template integration allows creating entities which derive their values from other data. This is done by specifying templates for properties of an entity, like the name or the state.
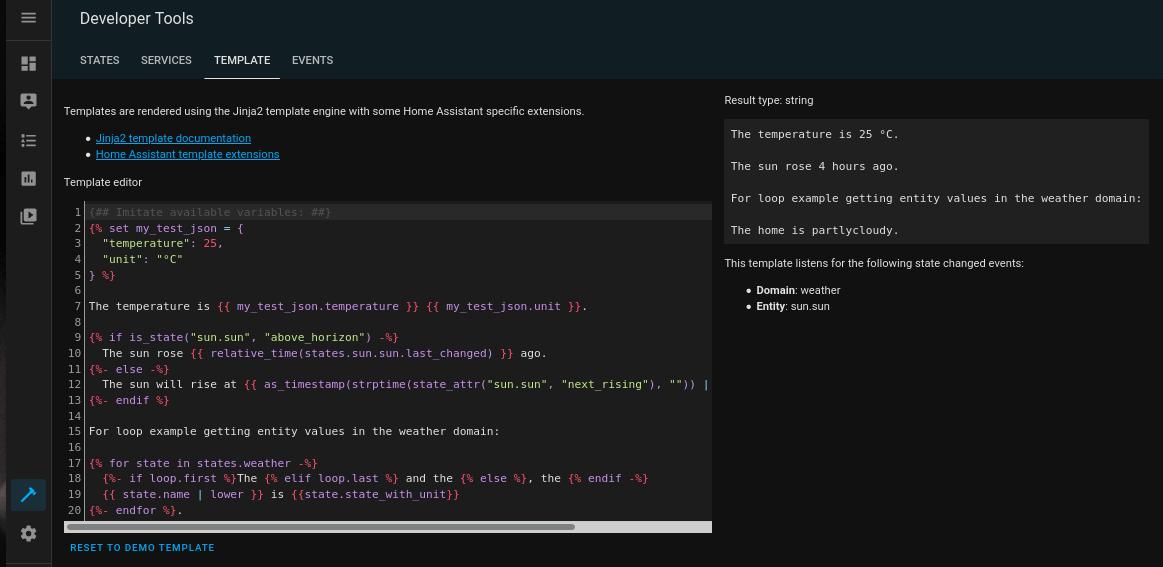
Building templates is fairly easy once you get the hang of the syntax. In short, templates follow the Jinja2 templating engine and are mainly used to perform mathematical operations (+, -, *, /) and logic tests (if __ , then __ ) but can also do loops (for i in states.sensor, __ ), for example. As a result, templates give users a scripting tool to go beyond the HASS built-in functionalities. To test and preview a customized template, use the Developer Tools > Template tab:
As an example, let’s create an entity to store and round to zero the sun.sun elevation attribute. First, in the configuration.yaml, append (add to the bottom) a reference to the templates.yaml configuration file:
# Templates
template: !include templates.yaml
Then, use a text editor to create an empty templates.yaml file and create a sensor template for the sun elevation, as follows:
# Sensor templates
- sensor:
    - name: "templatesunelevation"
      unit_of_measurement: "°"
      state: >
        {{ state_attr('sun.sun', 'elevation') | float | round(0) }}
Notice that in state:, we use state_attr() to retrieve the elevation attribute of the sun.sun entity. Then, we use float to force the output to a floating point number, which ensures that the output is interpreted as a number, and run round(0) on the numeric output to round the decimals to zero cases. The result should be an integer of the Sun elevation. (Alternatively, we could simply use int to convert the output to an integer, of course.)
I find the use of the folded style (>) very helpful in keeping the templates organized. Refer to the YAML - Scalars documentation for more information.
Check your configuration.yaml file for errors (Configuration > Server Controls > Configuration validation), and finally, restart your HASS. Afterwards, navigate to Developers Tools > States and if everything is correct, you should see a new sensor.template_sun_elevation entity:
By default, the values of this newly created entity will update as soon as the Sun elevation attribute changes. However, it is also possible to configure different triggers for template entities. This is particularly relevant for the next topic, namely data sampling.
Sampling
Devices, sensors, and services measure and transmit data with a certain frequency, which I refer by the term measurement resolution. Such a resolution might be determined by a time-based rule (e.g., every 1 sec) or an event (HTTP request) or a combination of both. Regardless of the nature of the trigger, the higher the measurement resolution, the more frequent the observations are. For example, an ESP32 Development board connected to a BME280 environmental sensor might send a temperature measurement every 5 minutes to a MQTT broker. Therefore, for all intended purposes, the measurement resolution of such a temperature sensor is at best 5 minutes. Now, if a second ESP32 measures and send data every 1 minute instead, then the measurement resolution of the latter ESP32 is higher than the former (i.e., we can expect it to send temperature data more frequently).
As mentioned before, in HASS, template entities follow state-based updates by default–that is, they update as soon as the data of any of the referenced entities change. Let’s say that over a 20-min window, none of the referenced data changed. This means that the template entity also didn’t change and more importantly, in the DB, there will be a single data point over the 20-min window. However, let’s say that over the same 20-min window, one of the referenced data changed twice. This means that the template entity now changed twice and more importantly, in the DB, there will be three data points over the 20-min window. This a very efficient way of storing data but you can probably see how this might affect the usage of analytical tools, owing to an inconsistent number of data points over equal time-frames as well as the under-representation of data over time.
Fortunately, just like we specify triggers for automations, HASS offers the possibility to specify triggers for template entities. There’s a large variety of triggers that can be used here (e.g, webhook, mqtt) but for longitudinal analysis, the most useful one is the time pattern trigger, which is aptly called time_pattern. Time pattern triggers can be specified for hours (hours:), minutes (minutes:), and seconds (seconds:), and for each one, it’s possible to prefix the value with a / to match whenever the current value is divisible by the specified value (e.g., hours: "/2" will match every 2 hours) or use * to match any value (e.g., minutes: "*" to match every minute).
To create a time pattern trigger for one or more template entity sensor, simply add a list of time-based sensor: and binary_sensor: under a trigger: configuration in the templates.yaml configuration file, as follows:
# Time pattern trigger
- trigger:
    - platform: time_pattern
      # Update every 5 minutes
      minutes: "/5"
  # Sensor templates
  sensor:
    - name: "templatesunelevation-time-based"
      unit_of_measurement: "°"
      state: >
        {{ state_attr('sun.sun', 'elevation') | float | round(0) }}
      attributes:
        timestamp: >
          {{ as_timestamp(now()) }}
Of note, the timestamp: under attributes: forces HASS to create a new entry on the DB (update) whenever the template is triggered. This keeps the number of data points constant over time and each one of them will have a timestamp as attribute. (In the DB, you will also see that if the state remained unchanged, it maintains the correct last_changed date and updates the last_updated variable.)
Also, notice that it does not make sense to use a time_pattern trigger rule that has higher resolution than the device’s measurement resolution because then, there’s no chance for a new value to occur and the DB would just repeat the last transmitted measurement. Ideally, the time pattern should match the measurement resolution but to save space, you might want to set a lower time pattern resolution (as in 1:2, or 1:4, and so on).
Beware that depending on how triggers are configured and how many template entities are created, the HASS DB might end up using a lot of space and computations are bound to use ever more CPU (and possibly RAM) resources, owing to the number of entries in the DB. Be sure to monitor such resources after configuring your HASS instance; Otherwise, your HASS instance might experience serious problems.
Finally, there is the topic of statistical sampling (representativeness) when it comes to making generalizations from a couple of samples (e.g., environmental sensors in my bedroom and kitchen) to a population (temperature and humidity in my entire house). In this guide, however, we will not delve too far into statistical inferences, owing to limitations of the current set of analytical tools. Nonetheless, extended service outages, for example, might comprise summary statistics. For proper representation, it is fundamental that your HASS has been running and collecting data for as long as the monitored time period of any statistic. To put it in simple, a sensor that monitors weekly activity, for example, won’t make sense until your HASS instance has been running and collecting data over at least one week.
Utilities
The Utility integrations offer users tools to parse and analyze data from recorded entities. There are more than 30 different such integrations and they sometimes have overlapping functionalities. For example, the gradient (ratio of change) over the last two data points can be computed by both the Trend integration and the Derivative. In what follows, I covered only three of the utility integrations that I find most comprehensive and useful, namely:
- History Stats
- Statistics
- Trend
Trend is covered last because out of the set, it’s the only one that actually makes use of inferential tools via the Python package numpy. The others provide counting, other mathematical resources, and ways of summarize historical data. For each utility, I provided a brief description, usage examples to follow along, and reference to the documentation and source code.
History Stats
The History Stats integration provides useful statistics for discrete variables over a user-specified time-range. More specifically, this integration can do one of three things depending on the chosen type of sensor:
type: time: calculate the amount of hours that an entity has spent on a given state;type: ratio: calculate the percentage of time that an entity has spent on a given state;type: count: count how many times an entity has changed to a given state.
The use of this integration requires specification of at least two of the following time period variables:
start:: It indicates when the time period starts. Use time templating to specify the time;end:: It indicates when the time period ends. Use time templating to specify the time;duration:: It indicates how long the time period lasts. If start: is specified, then how long forwards; if end: is specified, then how long backwards. The syntax can be either the traditional HH:MM:SS format or as follows:
duration:
  days: 2
  hours: 4
  minutes: 15
  seconds: 30
Usage examples
history_stats are defined as a platform (- platform: history_stats) under sensor: in your configuration.yaml file. To keep things organized, go to the configuration.yaml and append a reference to sensors.yaml, as follows:
# Sensors
sensor: !include sensors.yaml
Then using a text editor, create a sensors.yaml file where we will configure the following three history_stats sensors to consume the data from the default weather.home entity:
sunny yesterday hours: Number of hours that the weather.home entity remained in the sunny state yesterday;cloudy today ratio: Percentage of time that the weather.home entity remained in the cloudy state today;rainy week count: Number of times that the weather.home entity changed to the rainy state over the last seven days.
The Meteorologisk institutt (Met.no) is the current default meteorological information service used by HASS. This integration’s measurement resolution is 1 hour (via cloud polling) and it follows state-based updates (a new entry in the DB is only created if any of the values has changed).
To create those three history_stats sensor entities, append the following to sensors.yaml:
# History Stats
- platform: history_stats
  name: "sunnyyesterdayhours"
  entity_id: weather.home
  state: "sunny"
  type: time
  # end today at 00:00:00
  end: >
    {{ now().replace(hour=0, minute=0, second=0) }}
  # start 24h before the end time
  duration:
    hours: 24
- platform: history_stats
  name: "cloudytodayratio"
  entity_id: weather.home
  state: "cloudy"
  type: ratio
  # start today at 00:00:00
  start: >
    {{ now().replace(hour=0, minute=0, second=0) }}
  # end right now
  end: >
    {{ now() }}
- platform: history_stats
  name: "rainyweekcount"
  entity_id: weather.home
  state: "rainy"
  type: count
  # end right now
  end: >
    {{ now() }}
  # start 7 days before the end time
  duration:
    days: 7
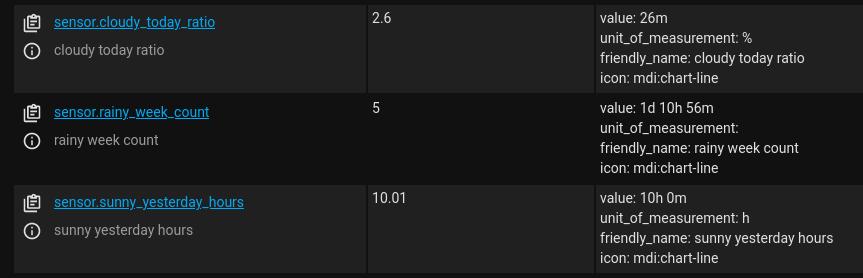
Now check your configuration file and if everything looks good, restart HASS. Afterwards, check your log file for related errors and if it all looks good, then head to Developer Tools > States and you should now see the three new entities we just created:
In the example above, it’s been cloudy for 2.6% of the time today, we had roughly 10 hours of sunny weather yesterday, and the weather changed to rainy 5 times over the week.
Because I have not been running HASS and collecting weather.home data over this week in a reliable way, the reported metrics can be quite misleading, as noted in the Sampling section. For a proper representation of the statistics over the configured time-range, make sure to keep your HASS instance running (and in this case, check that the cloud polling has been working without extended service outages) for at least as long as the configured time-range.
Additional references
Statistics
The Statistics integration is by far the most useful integration for describing the past values from other entities. In brief, it consumes the data from another entity and returns the traditional descriptive measures of central tendency (mean and median) and variability (quantiles, variance, standard_deviation, min_value, max_value), as well as a few other descriptive measures.
Similarly to the History Stats integration, the Statistics integration has two time period variables:
sampling_size: The maximum number of data points to be used within the max_age interval in descending order (oldest to newest). By default, it is 20;max_age: The maximum age of the oldest data point. This variable is equivalent to duration: in the History Stats when end: {{ now() }} and similarly, its time syntax can be defined in the traditional HH:MM:SS format or the following:
max_age:
  days: 3
  hours: 6
  minutes: 10
  seconds: 45
That is, max_age specifies an interval relative to now() in which the Statistics integration will collect a maximum number of data points equal to the sampling_size (e.g., 20) in descending order. If max_age is not specified, then it spans until the last value in the HASS DB for the given entity_id.
To illustrate how the specification of time works in this integration, let’s suppose we create a template sensor that triggers every 5 min and forces an update (DB entry), such as the sensor.template_sun_elevation_time_based from the Sampling section, and we leave it running for exactly 7 days from now. Therefore, the HASS DB collects 12 data points per hour for this template sensor, 288 data points per day, and 2016 data points per week. Now, because the sampling_size works in descending order, by default, it will compute statistics for the 20 oldest data points, which will range from exactly 7 days old to 6 days, 22 hours, and 20 minutes old (or simply from oldest until 100 minutes afterwards). However, if we also specified the max_age to 3 days ago, as follows:
then the time-range would instead span from exactly 3 days old to 2 days, 22 hours, 20 minutes old. Finally, because there will be 288 data points per day, if we set sampling_size: 288 in the last example, then the time-range would instead span from exactly 3 days old to 2 days old.
While proper configuration of the sampling_size and max_age allow for the specification of a variety of different time-ranges, it does require clear understanding of the entity’s measurement resolution and how it is updated in the DB because otherwise, the computed statistics are bound to misrepresent the desired time-ranges. I feel the History Stats integration is more flexible and precise in its definition of the time-range by using the more intuitive start:, end:, and duration: time variables. For example, the time templating used in the History Stats integration allows for the specification of any hour of any day (e.g., start yesterday at 00:00:00 and end today at 00:00:00), whereas such level of precision is not possible with the Statistics integration alone.
Usage examples
As before, statistics are defined as a platform (- platform: statistics) under sensor: in your configuration.yaml file. In this example, we will configure two statistics sensors to consume the data from the sensor.template_sun_elevation_time_based entity:
-
sun elevation one hour ago: Descriptive measures for the sensor.template_sun_elevation_time_based over the last one hour;
-
sun elevation one day ago: Descriptive measures for the sensor.template_sun_elevation_time_based over the last one day.
To create those two statistics sensor entities, append the following to the sensors.yaml:
# Statistics
- platform: statistics
  name: "sunelevationonehourago"
  entity_id: sensor.template_sun_elevation_time_based
  # measurement resolution is 5/min
  sampling_size: 12
  max_age:
    hours: 1
- platform: statistics
  name: "sunelevationonedayago"
  entity_id: sensor.template_sun_elevation_time_based
  # measurement resolution is 5/min
  sampling_size: 288
  max_age:
    days: 1
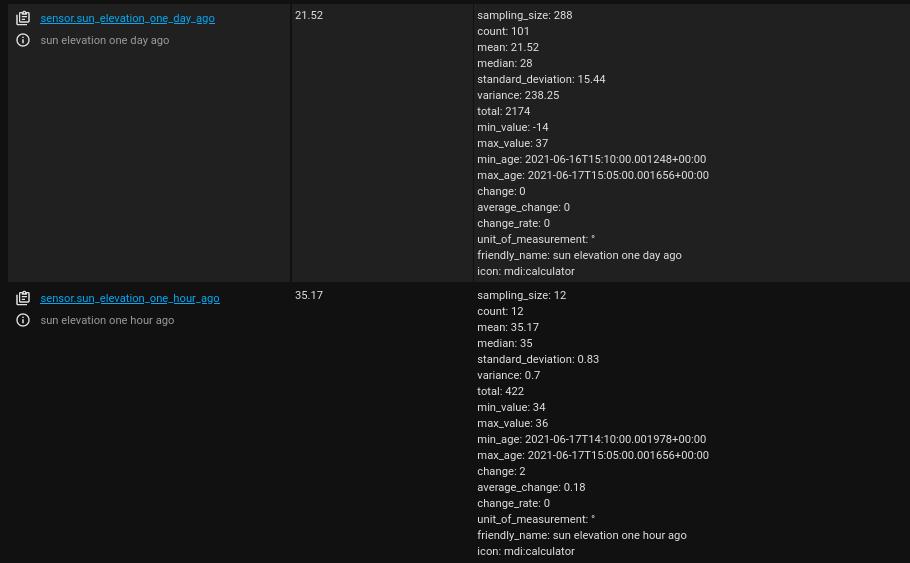
Now check your configuration file and if everything looks good, restart HASS. Afterwards, check your log file for related errors and if it all looks good, then head to Developer Tools > States and you should now see the two new entities we just created:
Notice that in sensor.sun_elevation_one_day_ago, the number of actual data points (count: 101) is lower than expected for this time-range (sampling_size: 288). This happened because my HASS instance has not been collecting the elevation attribute data from the sun.sun entity in a reliable fashion over the last day. However, in sensor.sun_elevation_one_hour_ago, the number of actual data points (count: 12) is indeed equal to the expected (sampling_size: 12). (Also, inspection of the min_age and max_age is very useful in making sure that the time-rage is the expected one.)
In addition, any statistics sensor entity shows the mean as both state and attribute. Other descriptive statistics for each statistics sensor entity are shown only as attribute. In the example, the Sun has increased in elevation from 34° to 36° over the last hour (min_value: 34, max_value: 36, change: 2), with an average of 35.2° above the horizon (mean: 35.17).
Now, weather data are much less predictable and subject to multiple sources of variability over time than the sun.sun metrics. As mentioned before, however, many of the default weather metrics (e.g., temperature, humidity, pressure) are provided as attributes of a state-based, cloud polling entity–namely, the weather.home entity that by default uses data from the Met.no integration. This poses multiple challenges to the analysis of the weather.home data over time but just as before, we can fix it by creating time-pattern, template sensors for each relevant attribute. To do so, append the following to the templates.yaml configuration file:
- trigger:
    - platform: time_pattern
      # Update every 1 hour
      hours: "/1"
  # Hourly sensor templates
  sensor:
    - name: "templateweathertemperature-time-based"
      unit_of_measurement: "C"
      state: >
        {{ state_attr('weather.home', 'temperature') | float | round(1) }}
      attributes:
        timestamp: >
          {{ as_timestamp(now()) }}
    - name: "templateweatherhumidity-time-based"
      unit_of_measurement: "%"
      state: >
        {{ state_attr('weather.home', 'humidity') | int }}
      attributes:
        timestamp: >
          {{ as_timestamp(now()) }}
    - name: "templateweatherpressure-time-based"
      unit_of_measurement: "hPa"
      state: >
        {{ state_attr('weather.home', 'pressure') | float | round(1) }}
      attributes:
        timestamp: >
          {{ as_timestamp(now()) }}
The time_pattern trigger is every 1 hour because the measurement resolution for the Met.no integration is 1 hour. Obviously, if this is different for your weather integration, then set it to a different trigger value to match the measurement resolution.
Check your config and restart your HASS. Now wait for it to collect enough data points to allow meaningful analysis (at least 2 hours).
Afterwards, we will create the following three statistics sensors for the new entities which will provide descriptive metrics for each of them over a time period of one day:
-
weather temperature one day ago: Descriptive measures for the sensor.template_weather_temperature_time_based over the last one day;
-
weather humidity one day ago: Descriptive measures for the sensor.template_weather_humidity_time_based over the last one day;
-
weather pressure one day ago: Descriptive measures for the sensor.template_weather_pressure_time_based over the last one day;
To create those three statistics sensor entities, append the following to the sensors.yaml:
- platform: statistics
  name: "weathertemperatureonedayago"
  entity_id: sensor.template_weather_temperature_time_based
  # measurement resolution is 1/hour
  sampling_size: 24
  max_age:
    days: 1
- platform: statistics
  name: "weatherhumidityonedayago"
  entity_id: sensor.template_weather_humidity_time_based
  # measurement resolution is 1/hour
  sampling_size: 24
  max_age:
    days: 1
- platform: statistics
  name: "weatherpressureonedayago"
  entity_id: sensor.template_weather_pressure_time_based
  # measurement resolution is 1/hour
  sampling_size: 24
  max_age:
    days: 1
Once again, check your configuration file and then restart your HASS. Check your log file and wait at least one hour. Remember that such sensors will only update when the monitored entities also update, which in our case is every 1 hour. Afterwards, head to Developer Tools > States and you should now see the three new entities we just created:
This examples shows that over the last 24h, the temperature ranged from 9.7°C to 13.8°C, with a mean of 11.3°C and standard deviation of ±1.2°C.
Additional references
Trend
The Trend integration is the only one that depends on an external Python package, namely the numpy package, and it does exactly what you’d expect from its name: it provides a trend coefficient for the data set spanning a user-specified time period. More specifically, this integration fits a linear function to the data points of an entity–via NumPy’s np.polyfit() method–and outputs the slope of the function, which is called by gradient. As such, it is a very useful integration for any scenario in which we need to know whether the data are increasing or decreasing over time.
The specification of time in this integration is very similar to the Statistics integration, except that (a) sampling_size is now called max_samples, (b) max_age is now called sample_duration, and (c) the latter is specified in seconds instead of using a duration syntax. Specifically, the time period is specified by the following two time variables:
max_samples: The maximum number of data points. By default, it uses the last two data points (max_samples: 2);sample_duration: The duration (in seconds) of the oldest data point. By default, it is unconstrained (sample_duration: 0).
Usage examples
Contrary to the previous two utilities, a trend sensor is defined as a platform (- platform: trend) under binary_sensor: in your configuration.yaml file. For this reason, first, let’s include a reference to a binary_sensors.yaml in the configuration.yaml file, as follows:
# Binary sensors
binary_sensor: !include binary_sensors.yaml
Then using a text editor, create a binary_sensors.yaml file where we will configure the following four trend binary sensors to consume the data from the temperature, humidity, and pressure time-based template sensors, as well as the Sun elevation:
trend weather temperature six hours: Gradient of the sensor.template_weather_temperature_time_based template sensor over the last six hours;trend weather humidity six hours: Gradient of the sensor.template_weather_humidity_time_based template sensor over the last six hours;trend weather pressure twelve hours: Gradient of the sensor.template_weather_pressure_time_based template sensor over the last twelve hours;trend sun elevation twenty minutes: Gradient of the sensor.template_sun_elevation_time_based template sensor over the last twenty minutes;
To create those trend entities, append the following to the binary_sensors.yaml file:
# Trend
- platform: trend
  sensors:
    trend_weather_temperature_six_hours:
      entity_id: sensor.template_weather_temperature_time_based
      # resolution is 1/h
      max_samples: 6
      # 6 hours in seconds
      sample_duration: 21600
    trend_weather_humidity_six_hours:
      entity_id: sensor.template_weather_humidity_time_based
      # resolution is 1/h
      max_samples: 6
      # 6 hours in seconds
      sample_duration: 21600
    trend_weather_pressure_twelve_hours:
      entity_id: sensor.template_weather_pressure_time_based
      # resolution is 1/h
      max_samples: 12
      # 12 hours in seconds
      sample_duration: 43200
    trend_sun_elevation_twenty_minutes:
      entity_id: sensor.template_sun_elevation_time_based
      # resolution is 1 every 5 minutes
      max_samples: 4
      # 20 minutes in seconds
      sample_duration: 1200
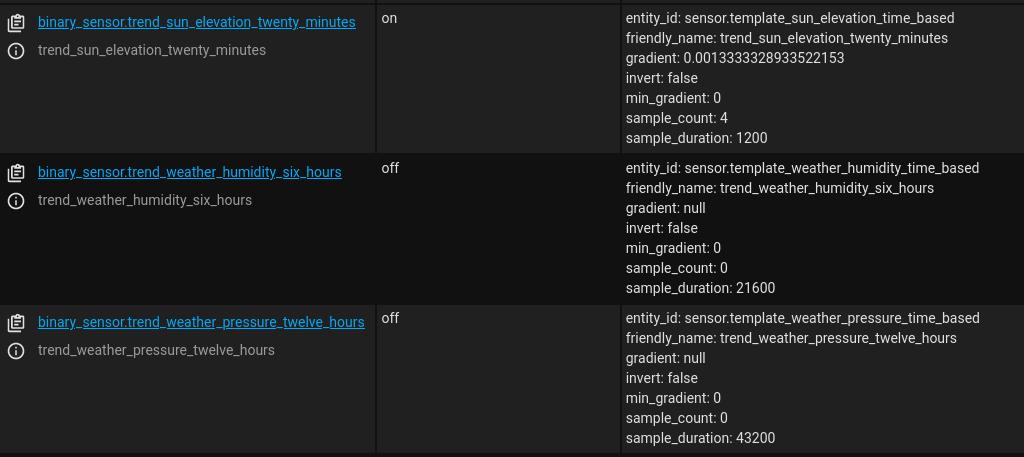
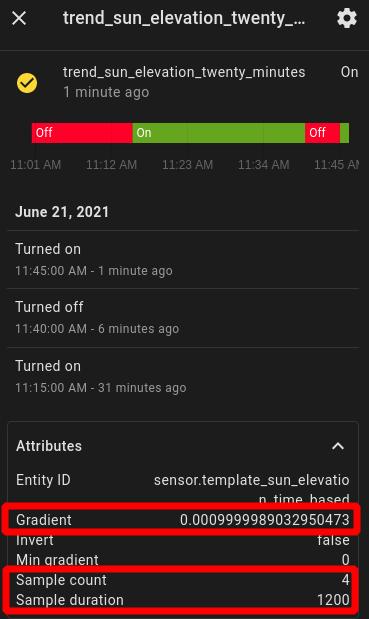
Check your configuration file and if everything looks good, restart HASS. Afterwards, check your log file for related errors and if it all looks good, then head to Developer Tools > States and you should now see the new trend entities we just created:
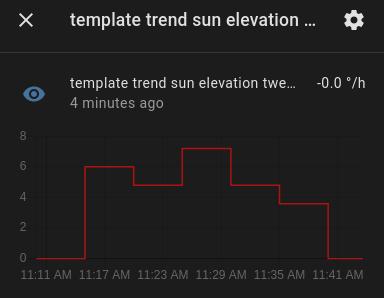
Two noteworthy observations need to be made at this point. First, notice that this integration does not analyze the data from previously stored entity data but actually stores its own data. Therefore, it’s necessary to keep it running to collect data from all monitored entities before drawing any meaningful conclusions from it. Second, the slope of the linear function that was fit over the data points (gradient) is reported as an attribute and because it uses seconds as time unit, the coefficient refers to the ratio of change per second. Therefore, to make it easier working with gradient, I usually create a slave entity to output the gradient as its state instead. This is accomplished with template sensors. More specifically, let’s append the following Trend helper entities under our default (state-based) Sensor Templates in the templates.yaml file:
    # Trend helper entities
    - name: "templatetrendsunelevationtwentyminutes"
      unit_of_measurement: "°/h"
      # if statement makes sure the gradient is valid
      # change the scale from sec to hour
      state: >
        {% if state_attr('binary_sensor.trend_sun_elevation_twenty_minutes', 'gradient') is number %}
           {{ (state_attr('binary_sensor.trend_sun_elevation_twenty_minutes', 'gradient') * 3600) | round(1) }}
        {% endif %}
    - name: "templatetrendweathertemperaturesixhours"
      unit_of_measurement: "C/h"
      state: >
        {% if state_attr('binary_sensor.trend_weather_temperature_six_hours', 'gradient') is number %}
           {{ (state_attr('binary_sensor.trend_weather_temperature_six_hours', 'gradient') * 3600) | round(2) }}
        {% endif %}
    - name: "templatetrendweatherhumiditysixhours"
      unit_of_measurement: "%/h"
      state: >
        {% if state_attr('binary_sensor.trend_weather_humidity_six_hours', 'gradient') is number %}
           {{ (state_attr('binary_sensor.trend_weather_humidity_six_hours', 'gradient') * 3600) | round(2) }}
        {% endif %}
    - name: "templatetrendweatherpressuretwelvehours"
      unit_of_measurement: "hPa/h"
      state: >
        {% if state_attr('binary_sensor.trend_weather_pressure_twelve_hours', 'gradient') is number %}
           {{ (state_attr('binary_sensor.trend_weather_pressure_twelve_hours', 'gradient') * 3600) | round(0) }}
        {% endif %}
The if statement is used to validate (is number) the appropriate variables in the unit conversion and rounding operations. Otherwise, the template sensor might attempt to perform a mathematical operation on something other than a number, such as when the gradient attribute is not yet defined, which would result in an error.
Now reload your configuration and afterwards, HASS will create new sensor.template_trend_* entities that should contain the converted gradient as their state.
Additional references
Visualizing analytical data
There are many different ways of using and visualizing the analytical data reported with the utilities described in this guide. Using the default configuration, for example, one might be inclined to display the mean or gradient using a History Graph Card.
In this section, however, we will learn about two dashboard resources that I think are better alternatives to the History Graph Card, namely the Mini Graph Card and the Lovelace Card Templater. More specifically, we will use the Mini Graph Card within the Lovelace Card Templater to build the following Dashboard card previewed in the Introduction:
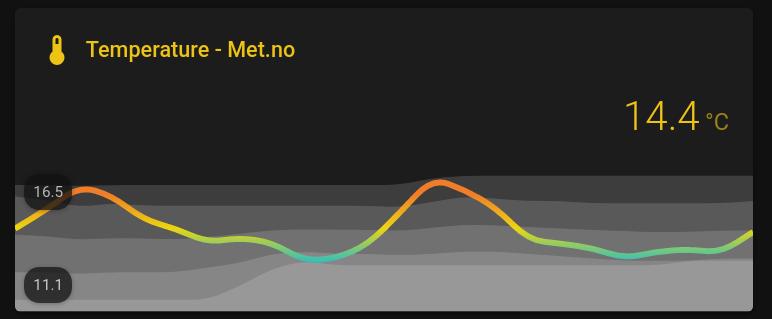
And here’s how it has changed a few hours later:
This card displays six temperature (Met.no) metrics over a 24h time-range:
-
The main (colored) line shows the current temperature, in which the colors are selected by the following ever changing (dynamic) thresholds:
| very high |
high |
low |
very low |
|---|
| max to (mean + stdev) |
(mean + stdev) to mean |
mean to (mean - stdev) |
(mean - stdev) to min |
And the corresponding colors were selected from the following palette (hex color code shown above the color label):
- The highest valued shaded area in the background corresponds to the max temperature over the last 24hrs;
- The second highest shaded area corresponds to plus one standard deviation from the mean temperature over the last 24hrs;
- The middle shaded area corresponds to the mean temperature over the last 24hrs;
- The second lowest value shaded area corresponds to minus one standard deviation from the mean temperature over the last 24hrs;
- And finally, the lowest shaded area corresponds to the min temperature over the last 24hrs.
The graph therefore provides a visually appealing way of assessing the current temperature relative to its 24hrs distribution, which is much more convenient than inspecting a table of values over time. Next, I will describe how to create the graph step-by-step.
How-to: Temperature with dynamic color thresholds
First, make sure you have an entity for each of the six metrics described before. All such metrics can be obtained from the Statistics integration, which will consume the data from a temperature sensor (e.g., weather.home via Met.no) and by using custom template sensors. More specifically, make sure your configuration.yaml file has an !include for both sensors.yaml and templates.yaml, as follows:
# Sensors
sensor: !include sensors.yaml
# Templates
template: !include templates.yaml
Then using a text editor, add the following to templates.yaml to create a time_pattern triggered entity that extracts and stores the temperature attribute from weather.home:
# Time pattern trigger
- trigger:
    - platform: time_pattern
      # Update every 1 hour
      hours: "/1"
  # Hourly sensor templates
  sensor:
    - name: "templateweathertemperature"
      unit_of_measurement: "C"
      state: >
        {% if state_attr('weather.home', 'temperature') is number %}
          {{ state_attr('weather.home', 'temperature') }}
        {% endif %}
      attributes:
        # Force an update with a timestamp change to ensure proper representation of state values over time
        timestamp: >
          {{ as_timestamp(now()) }}
In your sensors.yaml file, append the following to create a Statistics sensor for the temperature over the last 24hrs:
# Statistics
- platform: statistics
  name: "weathertemperatureoneday"
  entity_id: sensor.template_weather_temperature
  # measurement resolution is 1/hour
  sampling_size: 24
  max_age:
    days: 1
Now go back to templates.yaml and add a few helper entities to extract the attributes from the sensor.weather_temperature_one_day Statistics sensor, as follows:
# Sensor Templates
- sensor:
    # Statistics helper entities
    - name: "templateweathertemperatureonedaymeanplusstdev"
      unit_of_measurement: "C"
      state: >
        {% if state_attr('sensor.weather_temperature_one_day', 'mean') is number and state_attr('sensor.weather_temperature_one_day', 'standard_deviation') is number %}
           {{ (state_attr('sensor.weather_temperature_one_day', 'mean') + state_attr('sensor.weather_temperature_one_day', 'standard_deviation')) | round(1) }}
        {% endif %}
    - name: "templateweathertemperatureonedaymeanminusstdev"
      unit_of_measurement: "C"
      state: >
        {% if state_attr('sensor.weather_temperature_one_day', 'mean') is number and state_attr('sensor.weather_temperature_one_day', 'standard_deviation') is number %}
           {{ (state_attr('sensor.weather_temperature_one_day', 'mean') - state_attr('sensor.weather_temperature_one_day', 'standard_deviation')) | round(1) }}
        {% endif %}
    - name: "templateweathertemperatureonedaymax"
      unit_of_measurement: "C"
      state: >
        {% if state_attr('sensor.weather_temperature_one_day', 'max_value') is number %}
           {{ state_attr('sensor.weather_temperature_one_day', 'max_value') | round(1) }}
        {% endif %}
    - name: "templateweathertemperatureonedaymin"
      unit_of_measurement: "C"
      state: >
        {% if state_attr('sensor.weather_temperature_one_day', 'min_value') is number %}
           {{ state_attr('sensor.weather_temperature_one_day', 'min_value') | round(1) }}
        {% endif %}
As before, the if statements ensure the variables are valid (is number) before performing mathematical operations with them.
Finally, check your configuration and restart your HASS. Now wait at least one day because your new entities need to collect data before showing anything meaningful. But in the meantime, go ahead and install the two JavaScripts to your dashboard:
Personally, I prefer to install such resources manually, instead of using the Community Store. To do so:
- Download their respective
.js scripts to your HASS config/www/ directory;
- Navigate to Configuration > Lovelace Dashboards > Resources and select add resource;
- In the Add new resource window, set the URL to
/local/MODULE_NAME.js, in which MODULE_NAME will be the name of the JavaScript module (e.g., for the Mini Graph Card, that would be /local/mini-graph-card-bundle.js). HASS should automatically detect that the Resource Type is a JavaScript Module but if doesn’t, then select it;
- Press update and repeat the operation to add as many resources as necessary;
- Restart your HASS.
If an entire day has already passed, then you should be able to configure a proper graph card using the JavaScript modules you added to the HASS dashboard, as follows:
- Navigate to Overview > Edit Dashboard and select add card;
- Choose a Manual card and in the card configuration, paste the following:
type: custom:card-templater
card:
  type: custom:mini-graph-card
  name: Temperature - Met.no
  hours_to_show: 24
  animate: true
  align_state: right
  align_icon: left
  align_header: left
  font_size_header: 12
  font_size: 80
  decimals: 1
  line_width: 4
  entities:
    - entity: sensor.template_weather_temperature
      show_fill: false
      state_adaptive_color: true
      unit: °C
    - entity: sensor.template_weather_temperature_one_day_max
      show_line: false
      show_points: false
      color: white
    - entity: sensor.template_weather_temperature_one_day_mean_plus_stdev
      show_line: false
      show_points: false
      color: white
    - entity: sensor.weather_temperature_one_day
      show_line: false
      show_points: false
      color: white
    - entity: sensor.template_weather_temperature_one_day_mean_minus_stdev
      show_line: false
      show_points: false
      color: white
    - entity: sensor.template_weather_temperature_one_day_min
      show_line: false
      show_points: false
      color: white
  color_thresholds:
    - value_template: '{{states("sensor.template_weather_temperature_one_day_min")}}'
      color: '#0799BA'
    - value_template: '{{states("sensor.template_weather_temperature_one_day_mean_minus_stdev")}}'
      color: '#30BFBF'
    - value_template: '{{states("sensor.weather_temperature_one_day")}}'
      color: '#ECD711'
    - value_template: '{{states("sensor.template_weather_temperature_one_day_mean_plus_stdev")}}'
      color: '#F17D28'
  show:
    labels: true
    legend: false
    name_adaptive_color: true
    icon_adaptive_color: true
entities:
  - sensor.weather_temperature_one_day
  - sensor.template_weather_temperature_one_day_mean_plus_stdev
  - sensor.template_weather_temperature_one_day_mean_minus_stdev
  - sensor.template_weather_temperature_one_day_max
  - sensor.template_weather_temperature_one_day_min
That is it! You should now be able to see a graph similar to the following one:
If the values are not showing up correctly, check Developer Tools > States to make sure the entities are there and the states are displaying the correct values. If you want to reset the entity data, go to Developer Tools > Services, select recorder.purge_entities, select the entities you want to reset in Targets (e.g., sensor.weather_temperature_one_day), and press call service to purge their data.
Of course, many other options are available using the Mini Graph Card and the Lovelace Card Templater in combination with the other card options (e.g., Entities Card, Gauge Card). Feel free to explore them (and let me know about it, too).
top
In this guide, we’ve seen how the current set of analytical tools can greatly improve the way we describe past and current states. (The following was changed on August 14th, 2021, in connection with the addition of quantiles to the Statistics integration.) However, the lack of a flexible and standardized specification of the time variables make the current analytical tools very narrow in scope. Compare, for example, how the History Stats and the Statistics integration deal with the specification of a time period.
In addition, statistics is not just about summarizing the past; it is also a tool for making data-driven inferences about the future. This is a topic that I find largely unexplored in home automation systems and would allow for the creation of what I call inferential automations. Inferential automations determine actions based on abnormal states and measurements, for example, or reliable tendencies over a user-specified period of time:
- if the water level is significantly lower than yesterday, then __ .
- if the number of detected cars on my camera is significantly higher than thirty minutes ago, then __ .
- if the temperature started decreasing significantly over the last five minutes, then __ .
- if the VOC started increasing significantly over the last fifteen minutes, then __ .
Sadly, none of the integrations currently enables the use of inferential automations. The closest we have to such a thing is via the use of the Trend integration but even then, we lack the output of fit metrics for proper inference, such as the residuals of the least-square fit.
Of course, there’s a lot that can be done via templating but moving forward, there’s a need for advanced analytical integrations if we want to create inferential automations. As I pointed out before, HASS integrations are written in the Python programming language, which means we can take advantage of the various analytical packages that are already available in Python, such as:
For anyone who might want to help out, the folks at the HASS wiki were very kind to write a super detailed guide about developing new integrations:
Reach out if you are thinking about development.
top
This marks the end of this guide. My intention was to highlight a few of the currently available Utility integrations because they are rarely used but are fairly easy to implement and incredibly useful. There are a few gotchas to how data are sampled and stored in HASS, as well as how a few of the reviewed integrations work, which I hope were made verbatim in this guide and will help you decide what is best for your own use-case.
Moving forward, there is a clear trajectory for implementing what I called inferential automations. This begins with improving existing Utility integrations and ends with porting advanced analytical Python packages to the HASS environment. The culmination of this path is the largely unexplored concept of automating the future using data-driven inferences in home automation systems.
top